It's a common misconception, even among some knowledgeable SQL folks, that the SQL Server query optimizer evaluates different ways of executing a query and goes with the query plan that yields the lowest estimated cost. As is often the case with misconceptions, this one is not so wrong as oversimplified. The SQL Server query optimizer breaks queries into subsets called "groups" and optimizes the groups separately. It then assembles the optimized groups into a single query that, when executed, returns the rows the query writer asked for. (Hopefully, these are also the rows they wanted.)

In most cases, the query optimizer does an excellent job. However, in some cases, examining the query plan in the Management Studio can provide insights into how SQL Server might be provided with additional resources to help it execute a query faster.
Today we'll look at some techniques of no practical value unless you are curious about digging deeper into SQL Server to see how it works.
Some Undocumented Query Hints
In the world of Microsoft, "undocumented" usually means something more like "not officially documented." In any case, a few query hints let us examine more closely what the query optimizer has accomplished in preparing an execution plan.
We'll start by using the same query used to examine batch processing in the blog XXXXXXXXXXXX.
DBCC TRACEON (3604)SELECT d.CalendarMonth,SUM(fs.SalesAmount)--,SUM(fs.ReturnAmount)--,SUM(fs.SalesQuantity)--,SUM(fs.ReturnQuantity)FROM DimDate dJOIN FactSales fsON fs.DateKey = d.DateKeyGROUP BY d.CalendarMonthOPTION(RECOMPILE, QUERYTRACEON 8605);
The magical DBCC TRACEON (3604) must be executed to output these traces. Some people include QUERYTRACEON 3604 as a query hint, but since DBCC TRACEON (3604) has session-level scope, we need only run it once, and it will remain set for the duration of our session.
Note that the query hint includes "RECOMPILE." If we did not do this, the trace would only generate information the first time the query was run. On subsequent executions, the query would be cached, and there would be no optimizer output.
Trace 8605
The output for trace 8605 shows the input tree, laying out the logical operations implied by the query.
*** Converted Tree: ***LogOp_Project QCOL: [d].CalendarMonth COL: Expr1002LogOp_GbAgg OUT(QCOL: [d].CalendarMonth,COL: Expr1002 ,) BY(QCOL: [d].CalendarMonth,)LogOp_ProjectLogOp_JoinLogOp_Get TBL: DimDate(alias TBL: d) DimDate TableID=610101214 TableReferenceID=0 IsRow: COL: IsBaseRow1000LogOp_Get TBL: FactSales(alias TBL: fs) FactSales TableID=1602104748 TableReferenceID=0 IsRow: COL: IsBaseRow1001ScaOp_Comp x_cmpEqScaOp_Identifier QCOL: [fs].DateKeyScaOp_Identifier QCOL: [d].DatekeyAncOp_PrjListAncOp_PrjListAncOp_PrjEl COL: Expr1002ScaOp_AggFunc stopSum TransformedScaOp_Identifier QCOL: [fs].SalesAmountAncOp_PrjList
TRACE 8606
Trace 8606 shows intermediate steps in the processing of the input tree
*** Input Tree: ***LogOp_Project QCOL: [d].CalendarMonth COL: Expr1002LogOp_GbAgg OUT(QCOL: [d].CalendarMonth,COL: Expr1002 ,) BY(QCOL: [d].CalendarMonth,)LogOp_ProjectLogOp_SelectLogOp_JoinLogOp_Get TBL: DimDate(alias TBL: d) DimDate TableID=610101214 TableReferenceID=0 IsRow: COL: IsBaseRow1000LogOp_Get TBL: FactSales(alias TBL: fs) FactSales TableID=1602104748 TableReferenceID=0 IsRow: COL: IsBaseRow1001ScaOp_Const TI(bit,ML=1) XVAR(bit,Not Owned,Value=1)ScaOp_Comp x_cmpEqScaOp_Identifier QCOL: [fs].DateKeyScaOp_Identifier QCOL: [d].DatekeyAncOp_PrjListAncOp_PrjListAncOp_PrjEl COL: Expr1002ScaOp_AggFunc stopSum TransformedScaOp_Identifier QCOL: [fs].SalesAmountAncOp_PrjList*******************
*** Simplified Tree: ***LogOp_GbAgg OUT(QCOL: [d].CalendarMonth,COL: Expr1002 ,) BY(QCOL: [d].CalendarMonth,)LogOp_JoinLogOp_Get TBL: DimDate(alias TBL: d) DimDate TableID=610101214 TableReferenceID=0 IsRow: COL: IsBaseRow1000LogOp_Get TBL: FactSales(alias TBL: fs) FactSales TableID=1602104748 TableReferenceID=0 IsRow: COL: IsBaseRow1001ScaOp_Comp x_cmpEqScaOp_Identifier QCOL: [d].DatekeyScaOp_Identifier QCOL: [fs].DateKeyAncOp_PrjListAncOp_PrjEl COL: Expr1002ScaOp_AggFunc stopAccumScaOp_Identifier QCOL: [fs].SalesAmount*******************
*** Join-collapsed Tree: ***LogOp_GbAgg OUT(QCOL: [d].CalendarMonth,COL: Expr1002 ,) BY(QCOL: [d].CalendarMonth,)LogOp_JoinLogOp_Get TBL: DimDate(alias TBL: d) DimDate TableID=610101214 TableReferenceID=0 IsRow: COL: IsBaseRow1000LogOp_Get TBL: FactSales(alias TBL: fs) FactSales TableID=1602104748 TableReferenceID=0 IsRow: COL: IsBaseRow1001ScaOp_Comp x_cmpEqScaOp_Identifier QCOL: [d].DatekeyScaOp_Identifier QCOL: [fs].DateKeyAncOp_PrjListAncOp_PrjEl COL: Expr1002ScaOp_AggFunc stopAccumScaOp_Identifier QCOL: [fs].SalesAmount*******************
*** Tree Before Project Normalization ***LogOp_GbAgg OUT(QCOL: [d].CalendarMonth,COL: Expr1002 ,) BY(QCOL: [d].CalendarMonth,)LogOp_JoinLogOp_Get TBL: DimDate(alias TBL: d) DimDate TableID=610101214 TableReferenceID=0 IsRow: COL: IsBaseRow1000LogOp_Get TBL: FactSales(alias TBL: fs) FactSales TableID=1602104748 TableReferenceID=0 IsRow: COL: IsBaseRow1001ScaOp_Comp x_cmpEqScaOp_Identifier QCOL: [d].DatekeyScaOp_Identifier QCOL: [fs].DateKeyAncOp_PrjListAncOp_PrjEl COL: Expr1002ScaOp_AggFunc stopAccumScaOp_Identifier QCOL: [fs].SalesAmount*****************************************
*** Tree After Project Normalization ***LogOp_GbAgg OUT(QCOL: [d].CalendarMonth,COL: Expr1002 ,) BY(QCOL: [d].CalendarMonth,)LogOp_JoinLogOp_Get TBL: DimDate(alias TBL: d) DimDate TableID=610101214 TableReferenceID=0 IsRow: COL: IsBaseRow1000LogOp_Get TBL: FactSales(alias TBL: fs) FactSales TableID=1602104748 TableReferenceID=0 IsRow: COL: IsBaseRow1001ScaOp_Comp x_cmpEqScaOp_Identifier QCOL: [d].DatekeyScaOp_Identifier QCOL: [fs].DateKeyAncOp_PrjListAncOp_PrjEl COL: Expr1002ScaOp_AggFunc stopAccumScaOp_Identifier QCOL: [fs].SalesAmount
TRACE 8607
Trace 8607 shows the resulting output tree. Note that the operations labeled "LogOp" have disappeared and "PhyOp" operations have taken their place.*** Output Tree: ***Exchange StartPhyOp_ExecutionModeAdapter(BatchToRow)PhyOp_HashGbAgg(batch)<global> Eager DistinctPhyOp_Concat (batch)OUTPUT(COL: IsBaseRow1000 QCOL: [d].Datekey QCOL: [d].CalendarMonth QCOL: [fs].DateKey COL: partialagg1003 )CHILD(COL: IsBaseRow1000 QCOL: [d].Datekey QCOL: [d].CalendarMonth QCOL: [fs].DateKey COL: partialagg1003 )CHILD(COL: IsBaseRow1000 QCOL: [d].Datekey QCOL: [d].CalendarMonth QCOL: [fs].DateKey COL: partialagg1003 )PhyOp_HashJoinx_jtInner (batch)(QCOL: [fs].DateKey)= (QCOL: [d].Datekey)PhyOp_HashGbAgg(batch)<exact local> Eager DistinctPhyOp_Range TBL: FactSales(alias TBL: fs)(1) ASC Bmk ( QCOL: [fs].SalesKey) IsRow: COL: IsBaseRow1001AncOp_PrjListAncOp_PrjEl COL: partialagg1003ScaOp_AggFunc stopAccumScaOp_Identifier QCOL: [fs].SalesAmountPhyOp_Range TBL: DimDate(alias TBL: d)(1) ASC Bmk ( QCOL: [d].Datekey) IsRow: COL: IsBaseRow1000ScaOp_Comp x_cmpEqScaOp_Identifier QCOL: [d].DatekeyScaOp_Identifier QCOL: [fs].DateKeyPhyOp_ExecutionModeAdapter(RowToBatch)PhyOp_Apply lookup TBL: DimDate (0) (x_jtInner)PhyOp_ExecutionModeAdapter(BatchToRow)PhyOp_HashGbAgg(batch)<exact local> Eager Distinct [** 4 **]PhyOp_Range TBL: DimDate(alias TBL: d)(1) ASC Bmk ( QCOL: [d].Datekey) IsRow: COL: IsBaseRow1000ScaOp_Comp x_cmpEq[** 11 **]AncOp_PrjListAncOp_PrjEl COL: Expr1002ScaOp_AggFunc stopAccumNullScaOp_Identifier COL: partialagg1003
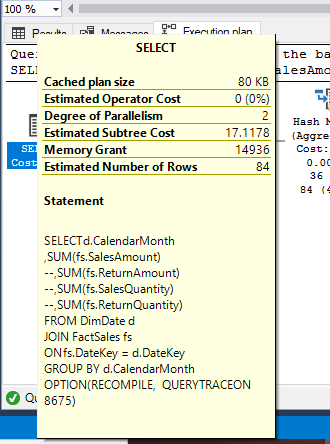
TRACE 8675
Trace 8675 doesn't provide much insight into the optimization process, but the report shows the estimated cost of alternative query plans.
End of simplification, time: 0 net: 0 total: 0 net: 0end exploration, tasks: 133 no total cost time: 0.001 net: 0.001 total: 0 net: 0.001end exploration, tasks: 134 no total cost time: 0 net: 0 total: 0 net: 0.001end exploration, tasks: 659 no total cost time: 0.007 net: 0.007 total: 0 net: 0.008end exploration, tasks: 662 no total cost time: 0 net: 0 total: 0 net: 0.009end exploration, tasks: 674 no total cost time: 0 net: 0 total: 0 net: 0.009end search(1), cost: 29.225 tasks: 674 time: 0 net: 0 total: 0 net: 0.009end exploration, tasks: 675 Cost = 29.225 time: 0 net: 0 total: 0 net: 0.009end exploration, tasks: 676 Cost = 29.225 time: 0 net: 0 total: 0 net: 0.009end exploration, tasks: 1353 Cost = 29.225 time: 0.002 net: 0.002 total: 0 net: 0.011end exploration, tasks: 1356 Cost = 29.225 time: 0 net: 0 total: 0 net: 0.011end exploration, tasks: 1422 Cost = 29.225 time: 0 net: 0 total: 0 net: 0.011end search(1), cost: 17.1178 tasks: 1422 time: 0 net: 0 total: 0 net: 0.011End of post optimization rewrite, time: 0 net: 0 total: 0 net: 0.012End of query plan compilation, time: 0 net: 0 total: 0 net: 0.012
Note that two different estimated costs have been highlighted in red. Not surprisingly, when we look at the actual execution plan, the smaller of the two appears as the estimated subtree cost for the SELECT icon.
Some Other Trace Flags
23722373
These traces provide information on the memory usage of the query tree logical optimizations:
86088609
Trace flags 8608 and 8609 provide further information about the query optimizer "memo." The memo is nothing more than a chalkboard on which the SQL Server writes pertinent information as it progresses through query optimization.
Conclusions
SQL Server continues to provide developers with more and deeper information on the query optimizer. This allows developers to gain insight, not to mention have more fun.
Find what you're looking for with SQL Training and Courses.
This piece was originally posted on October 10, 2021, and has been refreshed with updated styling.